Thursday, February 26, 2015

Part-I : Why do we need a Land Acquisition Act ? - A Game theoretic perspective

Agricultural land is much more than a mere capital asset owned by farmers. It is not only a source of livelihood but also a source of financial security, lifetime memories and emotional strength. Hence any parting with farmland, whether by volition or by force is always an emotional act for the farmer. That is why many argue, even if the farmer was compensated with a land of equal size and arability, things will no longer remain the same in his life. But for a rapidly growing and urbanizing country like India, industrial growth and urban expansion is inevitable. 


The objective of this article is restricted to one controversial aspect of the land acquisition process viz. Why do we need government intervention in the land acquisition process in the first place? Why can’t we let the buyers deal with the sellers directly via market mechanisms? 


Click here to read this full article that was published in Swarajya Magazine. 

Review of the Research Paper - Does Affirmative Action Affect the Productivity of Indian Railways?

A research study appeared recently that analysed the impact of affirmative action (caste based reservation system in India) on the productivity of a PSU (Indian Railways in this case). The study was conducted by Ashwini Deshpande & Thomas E. Weisskopf in 2011. A link to the pre-published version of this paper is available (here). This blog post is a review of this paper (strictly) based on the version hyper linked here. 


The objective of the study was to prove that caste based reservation system does not impact the productivity of an organization. A systematic study would not only shut the voices of people raising this concern against the reservation system, but also provide valuable supporting evidence for the Supreme Court of India to make a decision on several different Mandal Commission related cases pending before it. Although the claim of the authors may be true, is the study really producing such a clinching evidence to make such a claim in support of caste based reservation system? 


Here are some of my critical observations of the study :- 


  1. If you read the statement linking Footnote 4 and what the actual footnote 4 reads, you will get a good idea of how exactly the study flows in terms of linking things.
  2. Firstly at a conceptual level to argue that Labour mix significantly impacts how many passenger KMs are produced or not is a stretch for an asset intensive, capital good intensive industry like Railways. Secondly it is a monopoly and certain amount of captive demand will get filled irrespective of what the Labour mix is. And this captive demand will be increasing over time because of population explosion and increase in economic mobility in the country. This captive demand hike will NOT be captured by fixed effect time variable during regression. We need a dynamic time effect that is increasing with time to capture this effect. A better proxy is to use GDP of that year or for that state(zone) as a control variable. They have not controlled for this aspect. 
  3. Taking passenger KM as a measure of output assumes that demand is infinite and capacity utilization is not a function of demand. It is only the other production factors that influence how many passenger KMs are produced. I am not sure how Railways demand can be modeled this way de-linking from the demand. This is a critical concern that needs to be addressed. 
  4. Railways output in terms of Passenger KM is a function of how many new trains are launched and in which routes (which are budget announcements). One can argue time controls for this during regression. But a pure fixed effect regression may not adequately capture this. We need a better control variable. 
  5. Railways policy of how "crowded" their lines can be has evolved with time. With better technology (and some say reduction in safety standards) they have allowed for more "crowding" i.e. they run two consecutive trains on the same track with lesser time gap. One can argue technology controls for this effect. There is another issue with technology variable they have chosen and we will come to it later. 
  6. They are using FUEL QUANTITY as an independent variable. This is normally a good proxy for technology in many capital intensive industries e.g. Iron & Steel. But during regression this factor should pop up with a negative sign i.e. the quantity of fuel consumed for covering the same Passenger KM should decrease with time. This has not happened and this is already triggering alarm bells on how technology has been controlled for!!! 
  7. Any employee with time "learns" on the job. The rate of learning may be different for different employees. if critiques of caste reservation policy are to be taken seriously, they may argue this rate is different for different categories too. However the model makes no effort to consider the learning effect of employees both general and SC/ST over time. The existing model has a secularly increasing figure of %SC/ST over time. This variable combines older employees with newer employees and can produce a spurious result due to the presence of learning effect over time! This wont be captured by fixed effect time variable as it an interaction variable. 
  8. The first approach to comparison is some what naive and I dont lend too much credence to it. The second approach is a more appropriate to study a problem of this type. But what I don't understand is why has time adjustment not been made in the 2nd step regression in the second approach ? That has potential to throw spurious results. We need to see the exact equation they have used.
  9. Normally such problems should be strictly studied in a "difference in difference" approach by having a dataset that covers zones/time periods where the policy was not introduced with the ones after it was introduced. I understand they have data limitations in attempting to do anything like this. But at the same time they should give benefit of doubt to their limitations. 
To summarize the following red herrings stand out to me :- 
  1. Choose an industry such as Public sector Banks which are service businesses and the quality/productivity/performance will be strongly linked to the human resources they deploy. Furthermore banking sector is competitive and hence if people are unhappy, they will move to another competitor. This will make a more convincing case to study than an asset intensive monopoly like Railways.  
  2. Unlimited Demand assumption. This is invalid and needs to be accounted for. 
  3. Improper use of Fixed time effect as it does not capture dynamic captive demand surge
  4. Not controlling for Govt of India announcements and Railway "crowding" policy changes. 
  5. Not having a good proxy for Technology. In fact having a bad proxy. 
  6. Not accounting for the learning effect of the employees. 
It would be nice if they can overcome these limitations and produce better version of analysis so that we can all appreciate the results better.  

Aavin Scam - The indelible imprints of socialism on Milk cooperatives

Socialism is so deep rooted in Indian polity that its imprints are far reaching and pervasive. If one carefully studies the cause of many of the socio-political scams in India, their origins can easily be traced back to the failed philosophy of socialism. The pattern is usually the same; a noble social goal, misplaced socialistic implementation, opportunistic behaviour of all and concerned leading to massive corruption or cronyism. Although this pattern is commonplace, what baffles is the continued obsession of socialists to “fix” problems with the same set of tools. The kneejerk reaction of media analysts and policy makers to such scams is to either introduce more stringent laws or new bodies with extra policing responsibilities; both lead to more problems than solutions in the long run. It is this extraordinary obsession to address failed social goals with useless socialist tools that we hope to lay threadbare as a part of this article.

Tamilnadu is witness to a huge scam in Aavin (the government controlled cooperative milk dairy) involving siphoning of milk, adulteration and windfall profits to unscrupulous private agents. The scam broke out on Sep 19th 2014, 8 people have been arrested and since then regional media has gone hammer and tongs about this scam. For media clippings of this scam (in Tamil) click here. CB-CID of state police estimates the magnitude of theft to be 1500 to 2000 litres of milk per day per lorry. That is conservatively about 2 Lakhs litres of milk stolen every day, leading to a loss of 10 Crore per day to Aavin. The numbers aren’t quite in the order of national scams to make national headlines; but nevertheless the scam highlights what is wrong with our socialistic polity. Police have arrested the kingpin of this racket called Vaidyanathan; who owned & operated a fleet of container lorries that deliver milk collected from villages to the aavin processing centres. The modus-operandi of this scam is as follows. Farmers in villages supply the milk to the local aavin collection centres; where it is tested for quality and accepted. The collected milk is then loaded into container lorries with sealed tanks; and shipped to centralized processing centres. Quality Inspection of the milk offloaded from sealed containers in processing centres follows a less rigorous process. Vaidyanathan and his associates (who own the truck fleet that supplies logistics to aavin) have been alleged to have siphoned-off 20% of the milk enroute and instead replaced it with water or worse other chemical compounds. Their craft was unnoticed because they had the knack of replacing back the seal. The stolen milk was sold to private players and private dairies to earn windfall profits. The accused have been supplying logistics to aavin for more than 10 years, and hence the scam must have been in vogue for several years before these arrests were made. Media reports suggest that several aavin staffs and officials were in the know of this scam, but chose to ignore in exchange for pecuniary benefits. The story is no different from similar scams reported from Milk cooperatives and PSUs in other states. But what baffles is the set of tools proposed by policy analysts and policymakers to resolve this issue and prevent its recurrence.

So what do the experts say?
As usual opposition parties have called for a CBI inquiry; as if that is a panacea for curing such social ills. Media analysts have called for suspension and arrest of aavin officials who looked the other way when this scam was in the making. Some parties friendly to the government have predictably asked for an inquiry commission headed by an ex-judge. Some media experts have called for introduction of an expensive “sealing” technology to prevent siphoning-off stuff enroute. The more stupid ones have called for introduction of a thorough inspection and additional quality check at the factory gate to catch such abuses. The more ridiculous socialists have called for arrest and ban on private dairies and private processors that benefited from getting cheaper access to milk supplies. However not one analyst is willing to look at the root cause of the issue; the procurement price distortion in the factor market of milk consequent to the policies followed by aavin.

So what really is the scam?
The real scam is the price distortion in the factor markets for milk due to the practices of Aavin. A news report (Kumudam Reporter, dated 03/Aug/14) states that aavin procures milk from farmers for Rs. 21.50 per litre (was only Rs. 18.50 until Feb, 2014) in Vellore district, while the private dairies mostly operating out of the bordering Chitoor district of Andhra pay about Rs. 32 per litre. Estimates suggest that only 30% of the daily production of 10 Lakh litres of milk in Vellore district is sourced to aavin. About 50% of the milk is smuggled across the border and sourced to private dairies in Andhra. The remaining 20% of milk is procured by private dairies of Tamilnadu who are paying significantly more than aavin. Aavin retails processed milk to consumers at Rs. 27 to 31 per litre. It incurs a processing cost of about Rs.8 per litre. Hence estimates suggest that Vellore district aavin alone incurs a net loss of Rs. 80 Lakhs per month. At the state level, the loss to Aavin is about 5 Crores per month. Whereas private players in Tamilnadu procure milk at Rs. 32 from farmers and retail processed milk at Rs. 42 to 46 to make a decent profit. Does it need a PhD in management to realize that the root cause of all these distortionary practices is the uncompetitive procurement prices paid by aavin?

So why really do farmers sell milk to Aavin in the first place?
The first reason is availability of aavin procurement booths in every village; because private booths have limited penetration. Under-development of the procurement market, forces farmers living in these remote villages to sell their produce at uncompetitive rates to the monopsony of aavin. The second reason is the differences in the rigor of quality checks followed by aavin with that of private players. This is a classic case of “market of lemons”. Anyone with a quality produce can sell to private dairies and make higher profit, while the ones who need to “manage” the officials for pushing their low quality produce have to settle for aavin. The third reason is contractual. Government gives loans to farmers at subsidised interest rates for purchase of cows and cattle feed. This loan is disbursed by cooperative societies. As a part of this loan contract, farmers are expected to sell their entire produce to aavin. However this contract is difficult to enforce, because there is no way of determining what the entire produce is. Hence most farmers work around this contract, by selling 20 to 30% of their produce to aavin to remain compliant; while selling the balance to private players. Aren’t these opportunistic behaviours the natural course of players reacting to the market distortion?

So why can’t Aavin truly fix the scam?
So why can’t aavin truly fix this once for all, by bringing its procurement prices in-line with the prevalent prices in the factor market? The first obvious reason is the push back from consumers for any hike in retail prices. More than consumer protests or public antipathy, the ruling party fears that such a hike would hand over a political brownie point to the opposition. The second reason is the unwillingness of aavin officials to adopt any such market-oriented model. The current model suits them because they can hide their uncompetitiveness in processing costs under the garb of low retail prices. It also gives them the discretionary right to fix prices and fudge quality norms. Moving to a market model also denies them the opportunity to earn rents. Hence under the garb of public welfare, their unions are capable of stopping this essential service using dharnas and strikes. The third reason is the push back from cooperative societies whose sole existence is justified by the disbursement and collection of cattle loans. If milk is procured at market prices from farmers, then it makes no sense to dish out commercial loans at subsidised interest rates. Asking such cooperatives to compete in an open financial market exposes their inefficiency in operations and denies them the ability to earn influence rents in selection of borrowers. So the three pillars of socialist legacy in the cooperative milk market; consumers, aavin officials and cooperative societies are ALL unwilling to address the real root cause of the problem.

So where do we go from here?
We go nowhere is the answer! The arrested suspects may be punished. Some aavin officials may be suspended for some duration. An expert committee may recommend an expensive sealing technology, verification of antecedents of logistics providers etc. Already two private processors who make milk halwa (milk guava) out of the stolen milk have been arrested. An inquiry will be launched against private dairies that purchased the milk. This tool of harassment will then need to be ‘managed’ by the private dairies to get certified hat they were unaware of the antecedents of the milk they sourced. The public will be happy that the government has taken prompt action against adulterers; that too without raising retail prices. And then everything will be forgotten; until the next socialist policy pothole will blow right under our nose! And never mind, our policy experts will bring the same set of tools to fix those potholes; only for it to open up elsewhere.


Sunday, October 12, 2014

Has the Welfare State gone Well too Far ?

Welfare State refers to a governance model where State plays an active interventionist role for the protection of social and economic well-being of its citizens. The guiding principles of a Welfare state are equal opportunity, equitable distribution of wealth and public responsibility of the state towards citizens who are unable to avail themselves of minimum provisions for a good life.

This article presents a five criteria framework to assess the functioning of a welfare state. To illustrate concepts better, we use the case of State of Tamilnadu; which has been receiving rave appreciation and brickbats at equal measure for being a successful welfare state. For reading the article from Swarajya Magazine website, click here

Sunday, April 20, 2014

Analysis & Predictions for TN LS 2014 Polls

I am a firm believer that sampling vote shares at state level and then extrapolating it to wins for each party – does not work well in the “first past post” Indian system. This post is my attempt to gauge constituency wise mood to arrive at seat predictions for Tamilnadu in the upcoming LS polls 2014; where people get to cast their vote on 24th April 2014.

Several leading regional media houses have published constituency wise survey results. I am going to triangulate these sources, plus apply my own observation from several field reports to arrive at the predictions. Warning: Such triangulation by heuristics have systemic biases which can affect reliability of results; however this is the best one can do, when he/she doesn’t have access to the primary data to do a formal statistical Meta-Analysis of the results. The sources that I referred to are:-  
  • Kumudam surveyed a record 66,100 respondents from all 39 constituencies of Tamilnadu. The demographic breakup was 62% male – 38% female; which is having a larger male skew. Their demographic sample included 11% first time voters, 13% school dropouts, 32.7% graduates+. Again they have a higher skew of graduates. They partnered with Statistics professor from Madras University T. R. Gopalakrishnan.  
  • ThanthiTV surveyed 20,000 respondents from all the constituencies. They have not shared the demographic breakup, however have stated that all the standard precautions in stratification of sample have been taken care. Their partner was Kris info media.
  • Thuglaq weekly surveyed 10,000 respondents from all 39 constituencies. They did not follow a statistical process, but they use a qualitative methodology to interpret results based on findings from the field. Their results were fairly accurate in the 2011 assembly polls giving it some credence.
  • Nakkeran magazine also did its predictions – but I summarily discount them as a source – given their political lineation and previous track record of complete failure.
  • Vikatan has done a survey of 27,000 respondents and given projected state level vote share. However since constituency wise break-up & demographic break-up is not available, I am constrained to not use this as a source. However I am using the field reports filed in Junior Vikatan.
  
Summary

Region
Party
> 70% Probability
50 to 70% Probability
Low Margin  Close Call
Total
Chennai
(4)
ADMK

1

1
DMK
1

2
3
NDA


0
North TN
(10)
ADMK
2
2
1
5
DMK

3
1
4
NDA


1
1
Delta
(6)
ADMK
1
2
1
4
DMK
1
1

2
NDA


0
Kongu
(9)
ADMK

1
3
4
DMK

1

1
NDA

1
3
4
South TN
(10)
ADMK
1
2
3
6
DMK


1
1
NDA
2
1

3
State
(39)
ADMK
4
8
8
20
DMK
2
5
4
11
NDA
2
2
4
8

So the predictions are ADMK - 20 , DMK - 11 and NDA - 8 

The above table takes into account our stab on who would win each of the 16 constituencies that were classified as close calls. If our predictions on closed calls go the other way, then there are upside and downside possibilities for each of the alliances. Accordingly we provide the forecasts as range of seats below. These can be treated as safe bets of the likely electoral outcome.

ADMK - 12 to 28
DMK – 7 to 16
NDA – 4 to 13

For the complete analysis including seat-wise mood meter & predictions, please read the full article hosted on CRI website here


Saturday, April 19, 2014

Recalibrating the Creature called AAP

This article is second in the series- in attempting to understand the turn of events in AAP and what it means to centre right thinkers. The earlier article with the title “Understanding the Creature called AAP” was written in December during the nascent stage of the party, when they had just formed the government in Delhi. The previous article had analyzed the bottom-up model of hierarchy (Swaraj) critically. 


This article looks at turn of events from the past three months & re-calibrates the positioning of AAP . It also critically explains the "People strategy" of AAP and who will stay, who will join, and what will happen to the party post May 16th. 


Continue to read the detailed article from CRI Website here


Sunday, February 9, 2014

Thanthi TV - Tamilnadu LS 2014 Pre-poll Survey Results

** Updated on 10/Apr/14 on Telecast up to 09/Apr/14  with 40 / 40 constituencies *** 
** NDA Mega Alliance is Confirmed. Congress and Communists are now assumed to contest separately ** 
** Major revisions made to constituencies 1 to 40 owing to revised vote-shares shared on the summary program telecast on 13/Feb, 26/Feb, 12/Mar, 25/Mar and 09/Apr. Thanthi TV telecasts a summary program for every 8 constituencies, and the vote-shares presented there are generally deviant from nested figures shared in daily program. I am Not sure of their underlying logic, but all I can do is diligently revise the numbers when they present the summary ** 
** NO MORE UPDATES - THESE ARE FINAL FIGURES *

Thanthi TV is one of the leading Tamil news channels. It is owned by the Dina-thanthi group which sells the print daily with the same name. The group is highly respected, has no declared political leanings and has a track record of seven decades. Thanthi TV conducted a pre-poll survey across 40 Loksabha constituencies of Tamilnadu in the month of January 2014. The questionnaire had 24 questions for respondents to answer. The total sample size across 40 constituencies was 20,000 - one of the largest ever in TV history. 
The results from the survey are presented constituency wise every week day (Monday to Friday) at 9.30 PM IST on Thanthi TV. The program started on 3rd-Feb-2014. The TV show presents the pre-poll survey results; along with detailed analysis by a local expert, assembly constituency wise sentiment of people & open issues. The video clips are also available online hereAll copyrights of this survey rest with the source. The only motivation to publish the summary of the results is for benefit of audience, who do not understand Tamil.

This blog post will be updated regularly based on the results shared on a daily basis. Please bookmark this web-page and keep visiting to get an update. 
    
Summary - Region wise
In this section, I present the summary of results region-wise. The tables & graphs will be regularly updated as & when constituencies are added to the Details Section. 

Winners

Region
DMK+
NDA
ADMK+
Cong
Comm
Declared
TOTAL
Chennai
1

3


4
4
North


10


10
10
Delta
1

5


6
6
Kongu

1
8


9
9
South

1
9


10
10
Pondy


1

1
1
STATE
2
2
35
1
0
40
40

Second Place:        ADMK+: 5           NDA:  10             DMK+:  25          Cong: 0 

Note* 23 / 40 constituencies declared to as close-call within the margin of error of 10% - which is subject to change based on campaign. Based on margins  the projected range of seats for the parties are given below. 
ADMK+:       15 to 38  
NDA:              2 to  7 
DMK:              0 to  15

UPA Sentiment - The % of respondents who are either in favor or against UPA. 


PM Sentiment - The % of respondents who desire to see a particular candidate as Prime Minister; independent of whom they are actually going to vote for. 


AAP Sentiment -The % of respondents who are open to voting for Aam Aadmi Party; independent of their current declared preference. Note* Depending on the candidate selection and canvassing by AAP, a part of this group may switch to vote towards AAP. 


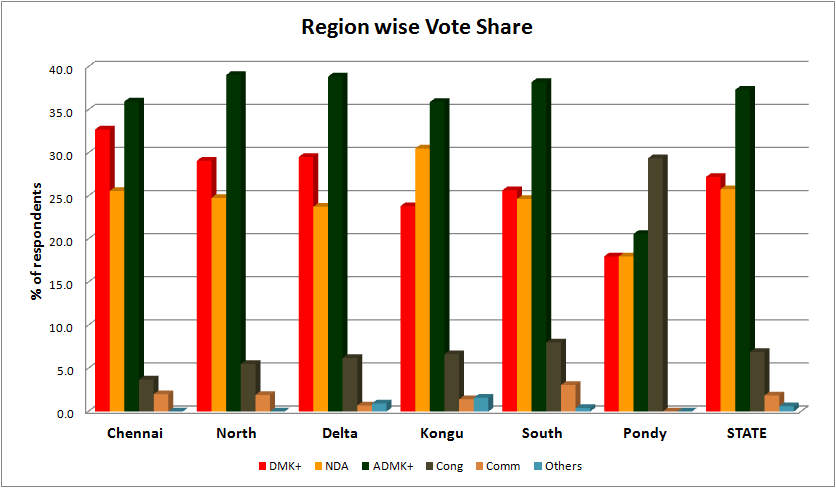
The below table gives the Vote share% of various alliances

Region
DMK+
NDA
ADMK+
Cong
Comm
Others
Chennai
32.7
25.6
36.0
3.7
2.0
0.0
North
29.1
24.8
39.1
5.5
1.9
0.0
Delta
29.5
23.8
38.9
6.2
0.7
0.9
Kongu
23.8
30.5
35.9
6.7
1.4
1.6
South
25.7
24.7
38.2
8.0
3.1
0.4
Pondy
18.0
18.0
20.6
29.4
0.0
0.0
STATE
27.2
25.8
37.3
6.9
1.9
0.6

The Alliance Vote-share is graphically shown below.


The Alliances are :- 
DMK+ - DMK, VCK, PT, MMK 
NDA - BJP, DMDK, MDMK, PMK, KMDK
ADMK+ - ADMK + Smaller allies
Cong and Communists are assumed to contest separately 

For the purpose of summarizing 39 constituencies in Tamilnadu are divided into 5 regions.
Chennai (4) - North, Central, South Chennai, & Sriperumpudur,
North (10) - Tiruvallur, Kanchipuram, Arakonam, Arani, Vellore, TVMalai, 4 in South Arcot
Delta (6) - Trichy, Permbalur, Thanjavur, Mayiladuthurai, Nagapattinam, Karur
Kongu (9) - K'giri, D'puri, Salem, Namakkal, Erode, Tiruppur, Kovai, Pollachi, Nilgris 
South (10) - Madurai, Dindugal, Ramnad, Sivagangai, Virudhunagar, Theni, Tuticorin, Nellai, Tenkasi, KanyaKumari  

Details - Constituency Wise
In this section, I present the details constituency-wise. The tables & graphs will be regularly updated as & when constituencies are added. The methodology that I have followed to compute the numbers from the survey questions shared by Thanthi TV is discussed at the end of this post. 

The below table gives a summary of "sentiment" of people constituency wise. 

UPA Sentiment
PM Sentiment
AAP Sentiment
Constituency
Favor
Against
NaMO
RaGa
Jaya
Others
Favor
Against
Kanyakumari
34
67
56
28
16
1
1
99
Nagapattinam
18
82
78
13
7
3
7
93
Arakonam
21
80
54
21
20
6
11
89
Vellore
44
57
54
42
5
0
34
66
Krishnagiri
11
90
69
12
20
0
11
89
Mayiladuthurai
15
86
72
14
13
2
9
91
Nilgris
10
90
51
18
21
11
14
86
Chidambaram
7
93
75
8
15
3
9
91
Tirunelveli
25
75
56
23
15
7
2
98
Tiruppur
17
83
51
14
24
11
3
97
Trichy
34
66
53
26
21
1
22
78
Madurai
34
67
47
23
24
7
15
85
Tenkasi
22
78
52
20
26
3
2
98
Tuticorin
26
74
50
27
20
4
14
86
Karur
23
77
67
17
10
7
7
93
Kanchipuram
36
65
51
37
13
0
1
99
Virudhunagar
35
65
52
41
8
0
20
80
North Chennai
30
70
52
20
28
1
8
92
Salem
17
84
78
19
4
0
28
72
Kadalur
39
62
61
34
6
0
18
82
Theni
38
62
54
26
18
3
29
71
Kovai
14
86
59
18
19
6
23
77
Ramnad
13
88
74
16
11
0
2
98
Tiruvallur
29
71
51
38
12
0
17
83
Dindugul
42
58
46
36
16
4
20
80
Sriperumpudur
35
65
52
31
13
5
9
91
Erode
29
71
68
26
6
1
13
87
Dharmapuri
20
80
67
23
11
0
11
89
Vilupuram
20
80
52
19
29
0
11
89
Perambalur
10
91
64
9
22
6
17
83
Arani
13
87
63
14
21
4
4
96
Pollachi
22
79
38
30
16
17
11
89
Tiruvannamalai
26
74
60
25
12
4
16
84
South Chennai
43
58
48
34
18
2
11
89
Kallakurichi
16
85
62
13
21
4
7
93
Central Chennai
23
78
45
20
27
9
3
97
Namakkal
27
73
48
19
30
4
14
86
Tanjore
10
90
70
11
12
8
7
93
Sivaganga
38
63
52
42
6
1
15
85
Pondy
21
80
67
15
14
5
5
95

The below table gives the Vote share% based on tentative alliances (suggested earlier). The projected winner is indicated in RED color. 2nd Place is in BLUE color. 

Vote Share %

Constituency
DMK+
NDA
ADMK+
Cong
Comm
Others
Kanyakumari
4.0
46.0
24.8
23.2
2.4
0.0
Nagapattinam
25.2
23.6
41.2
10.0
0.0
0.0
Arakonam
28.4
21.6
47.2
2.4
4.9
0.0
Vellore
24.8
28.0
28.4
18.0
0.0
0.0
Krishnagiri
28.8
25.4
36.0
9.0
0.8
0.0
Mayiladuthurai
22.8
30.4
36.0
8.8
1.9
0.0
Nilgris
2.4
50.8
19.6
19.6
0.0
6.8
Chidambaram
31.6
30.4
35.2
2.8
0.0
0.0
Tirunelveli
26.0
19.1
46.7
4.2
4.0
0.0
Tiruppur
19.0
24.2
38.4
6.0
4.9
7.5
Trichy
32.0
22.0
41.0
5.0
0.0
0.0
Madurai
36.0
16.0
38.0
5.0
5.0
0.0
Tenkasi
23.0
22.7
42.0
4.0
4.2
4.1
Tuticorin
28.0
23.8
41.0
6.0
1.2
0.0
Karur
28.0
17.4
44.0
5.0
0.0
5.6
Kanchipuram
27.0
19.0
46.0
8.0
0.0
0.0
Virudhunagar
22.5
27.0
39.8
7.3
3.4
0.0
North Chennai
30.0
24.0
35.0
5.0
6.0
0.0
Salem
24.0
26.0
42.0
4.0
4.0
0.0
Kadalur
20.0
28.0
44.0
3.1
4.9
0.0
Theni
30.3
22.0
40.0
4.3
3.4
0.0
Kovai
17.0
37.0
39.0
4.0
3.0
0.0
Ramnad
31.1
24.0
38.0
4.8
2.1
0.0
Tiruvallur
32.0
16.0
44.0
4.0
4.0
0.0
Dindugul
26.6
20.8
38.6
9.0
5.0
0.0
Sriperumpudur
32.9
24.4
39.7
3.0
0.0
0.0
Erode
31.0
22.0
40.4
6.6
0.0
0.0
Dharmapuri
32.7
28.6
34.0
4.7
0.0
0.0
Vilupuram
31.0
25.9
36.7
4.0
2.4
0.0
Perambalur
35.0
23.7
35.0
6.3
0.0
0.0
Arani
29.0
30.0
37.6
3.4
0.0
0.0
Pollachi
28.6
31.6
35.8
4.0
0.0
0.0
Tiruvannamalai
34.0
22.0
36.0
5.0
3.0
0.0
South Chennai
32.4
30.0
34.2
3.4
0.0
0.0
Kallakurichi
33.2
27.0
35.4
4.4
0.0
0.0
Central Chennai
35.6
24.0
35.0
3.4
2.0
0.0
Namakkal
31.0
29.0
38.0
2.0
0.0
0.0
Tanjore
34.2
25.4
36.0
2.1
2.3
0.0
Sivaganga
29.2
25.2
33.4
12.2
0.0
0.0
Pondy
18.0
18.0
20.6
29.4
0.0
0.0

Note* Where the gap between winner & 2nd place is < 10% is treated as close - and subject to change based on the campaign undertaken.  

Methodology
The methodology followed for summarizing the data shared by Thanthi TV is as follows. 

UPA sentiment is the average of the % of respondents who voted YES/NO for following two questions.  
  • Has UPA-2 delivered on its promises? 
  • Do you want to see UPA come back to power again? 
AAP sentiment is the % of the respondents who are aware about AAP and have expressed openness to vote for AAP.  i.e.  Favourable (Q3 Yes * Q4 Yes/100)  Against (100 - Favorable) 
  • Have you heard about the Aam Aadmi Party ? 
  • If yes, Will you vote for the Aam Aadmi Party ? 
PM sentiment is the average of the % of the respondents who voted YES/NO for following two questions.  
  • Whom do you desire to see as Prime Minister? 
  • Given the problems of India, whom do you think as PM can solve them? 
Thanthi TV also shares the vote share % in a nested manner. The exact figures are computed using the appropriate formula. 

Thanthi TV also shares data about another question on the likelihood of Jayalalitha becoming the PM. The answers are YES, NO and MAY BE. But that question is not considered in the reporting done on this blog post.